

MVRV Z-Score accurately predicts Bitcoin extremes, identifying overvalued and undervalued conditions for strategic investment decisions.
Indicator Overview
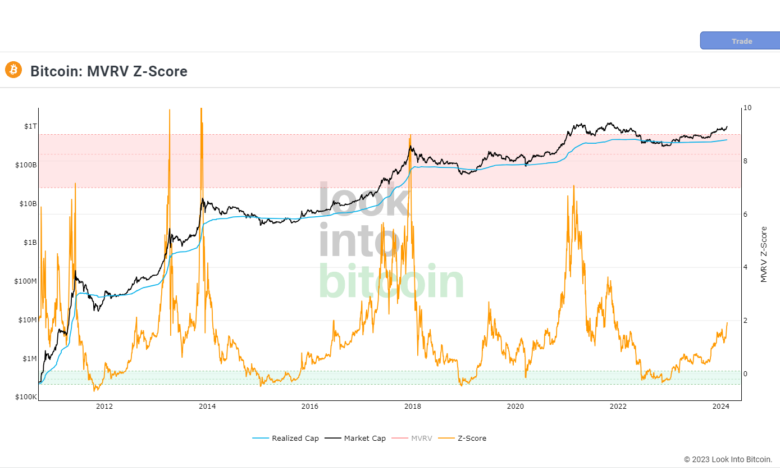
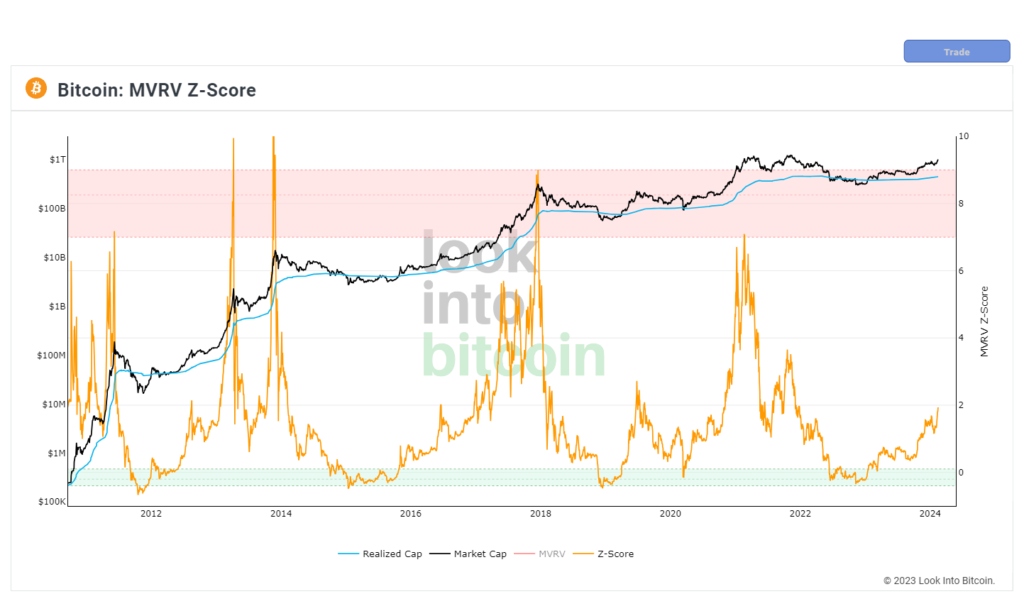
MVRV Z-Score is a bitcoin chart that uses blockchain analysis to identify periods where Bitcoin is extremely over or undervalued relative to its ‘fair value’.
It uses three metrics:
1. Market Value (black line): The current price of Bitcoin multiplied by the number of coins in circulation. This is like market cap in traditional markets i.e. share price multiplied by number of shares.
2. Realised Value (blue line): Rather than taking the current price of Bitcoin, Realised Value takes the price of each Bitcoin when it was last moved i.e. the last time it was sent from one wallet to another wallet. It then adds up all those individual prices and takes an average of them. It then multiplies that average price by the total number of coins in circulation.
In doing so, it strips out the short term market sentiment that we have within the Market Value metric. It can therefore be seen as a more ‘true’ long term measure of Bitcoin value which Market Value moves above and below depending on the market sentiment at the time.
3. Z-score (orange line): A standard deviation test that pulls out the extremes in the data between market value and realised value.
How It Can Be Used
The MVRV Z-score has historically been very effective in identifying periods where market value is moving unusually high above realised value. These periods are highlighted by the z-score (orange line) entering the pink box and indicates the top of market cycles. It has been able to pick the market high of each cycle to within two weeks.
It also shows when market value is far below realised value, highlighted by z-score entering the green box. Buying Bitcoin during these periods has historically produced outsized returns.
Bitcoin Price Prediction Using This Tool
MVRV Z-Score bitcoin chart is useful for predicting Bitcoin price at the extremes of market conditions. It is able to forecast where Bitcoin price may need to pull back when MVRV Z-score enters the upper red band, and also when $BTC price may rally after spending time in the lower green band.


 Bitcoin
  Ethereum
  XRP
XRP  Solana
  BNB
BNB  Dogecoin
  Cardano
  Avalanche
  Shiba Inu
  Aptos
Aptos  Arbitrum
  Injective
  Polygon